Century 21 People’s Choice Realty Inc., Brokerage
120 MATHESON BLVD E #103
MISSISSAUGA, Ontario
L4Z 1X1
Toronto, L'Amoreaux, M1S 4E7
$978,888
Listed by KELLER WILLIAMS ENERGY REAL ESTATE, BROKERAGE.
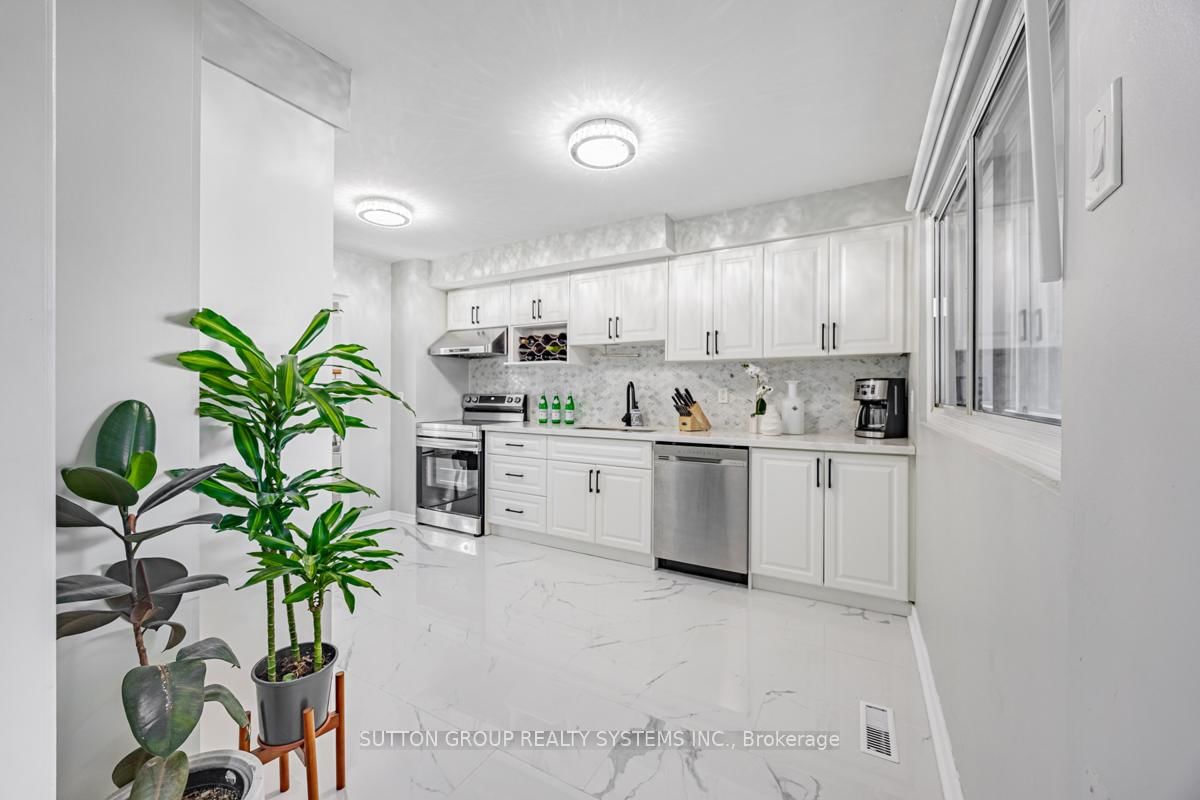
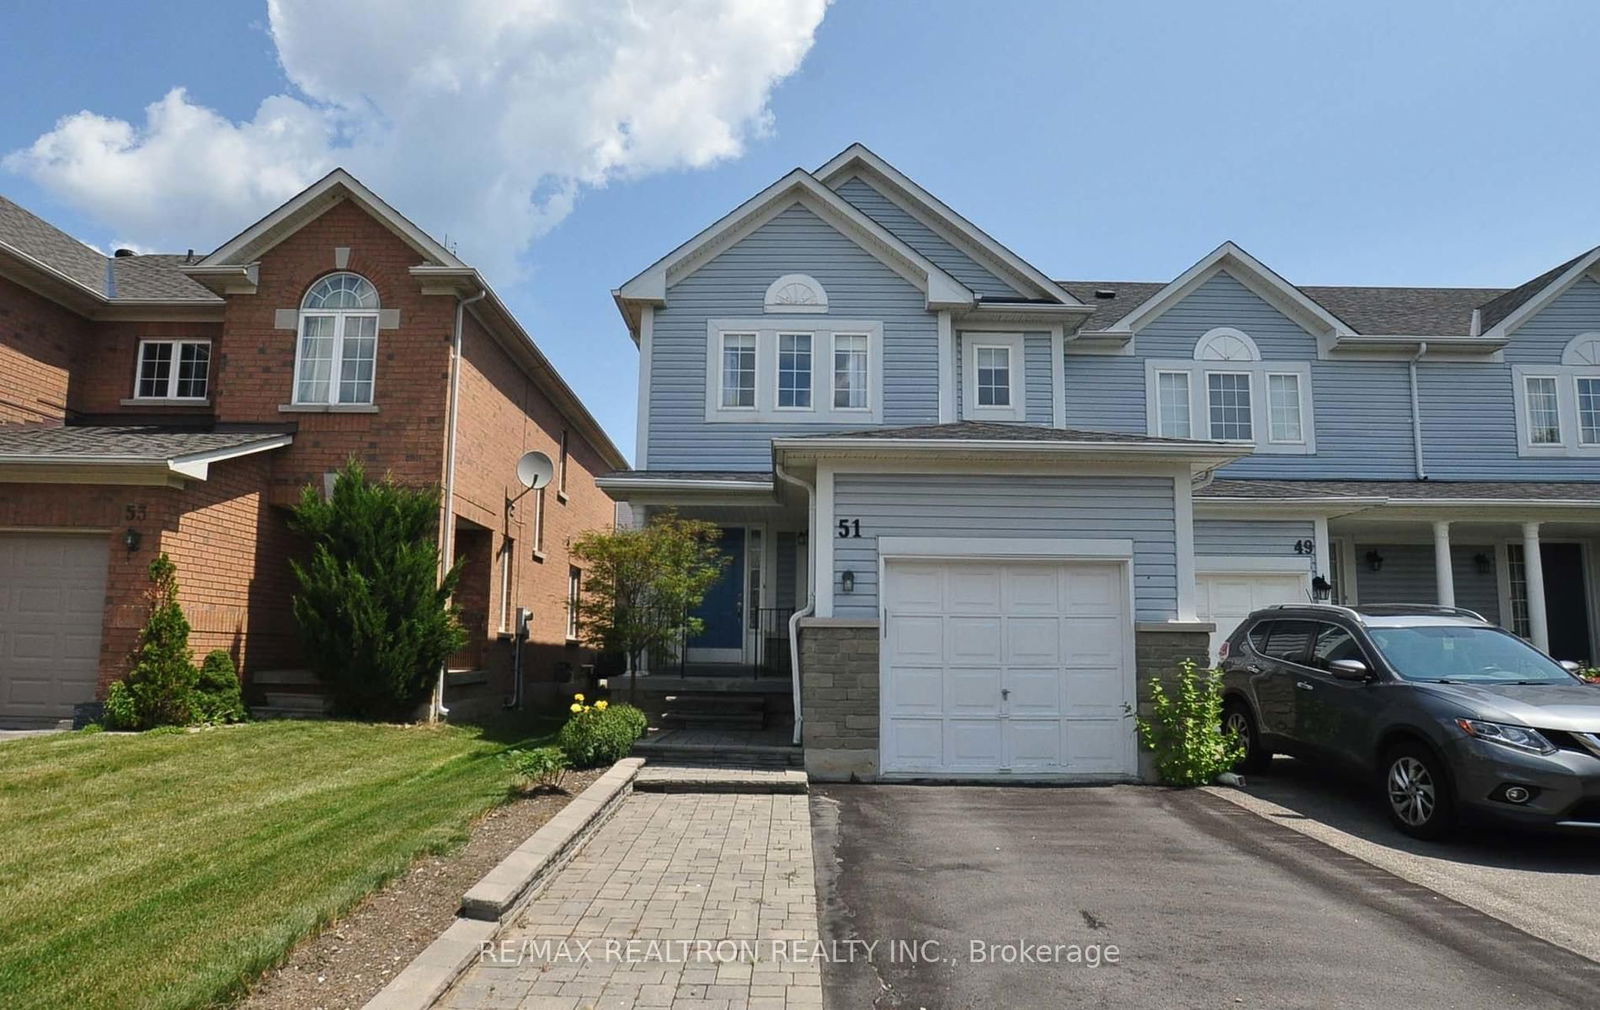
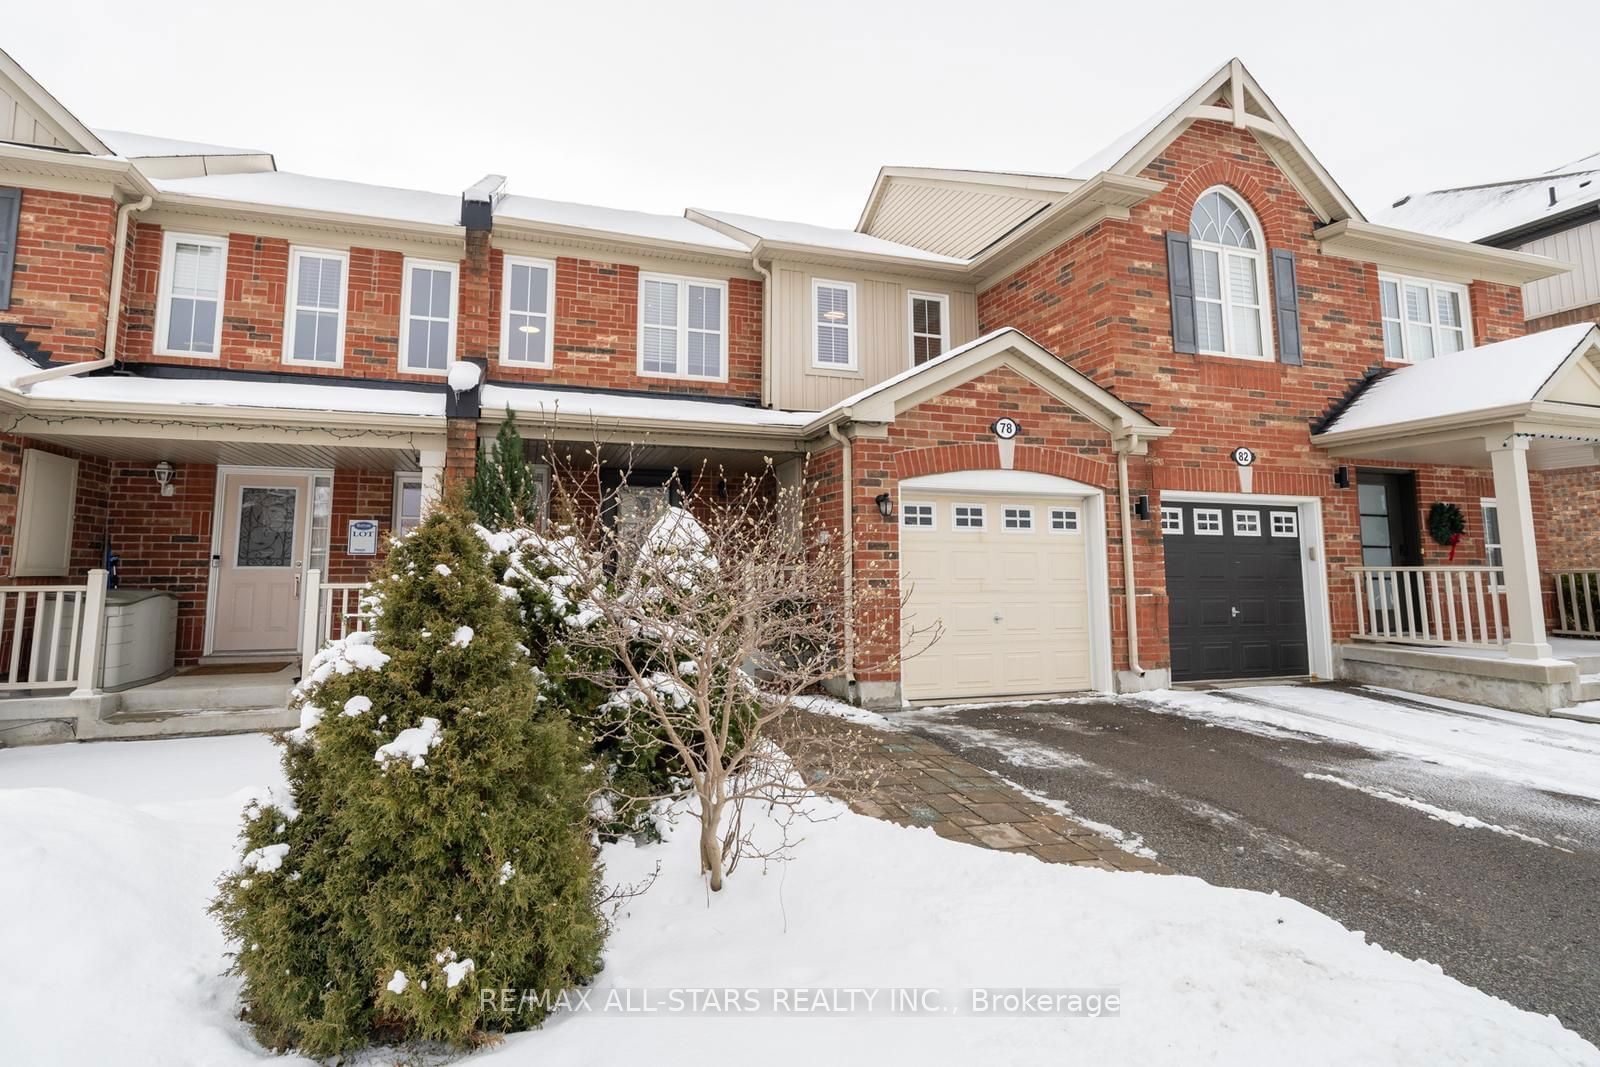
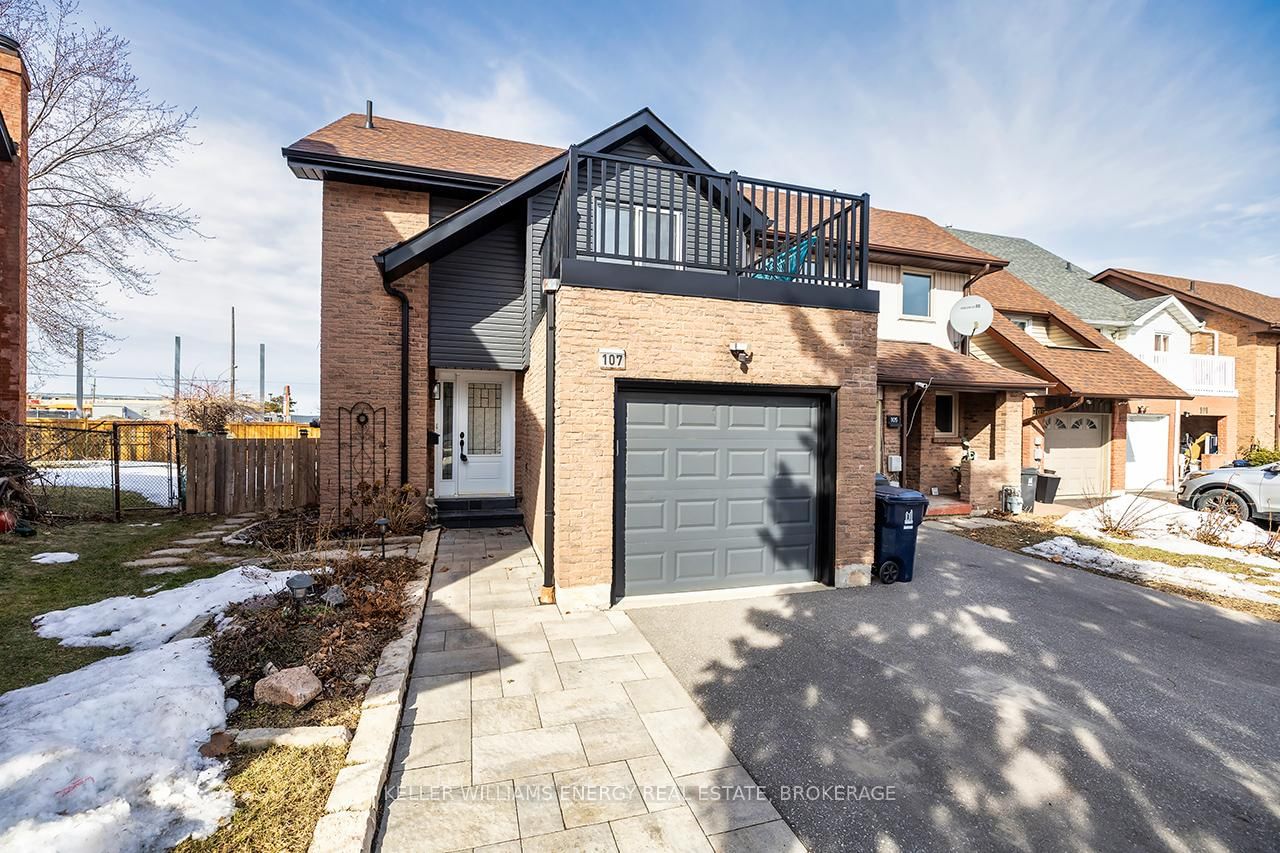
Welcome to This Absolute Stunning 3 Bedroom End Unit Freehold Townhouse! Bright and Spacious Layout, Open Concept Living & Dining Room Featuring Hardwood Flooring and Walk out to Backyard Oasis with Patio, Stunning Perennials Blooming Beautifully With Every Season & Four 4x8 Boxes for Vegetable Gardens! Renovated Eat-In Kitchen With Porcelain Flooring, Granite Counters, Backsplash & S/S Appliances! Renovated Powder Room! Upper Level Features Large Primary Bedroom with Walk out to Balcony, A place to enjoy your morning tea, Extra Large Closet & Renovated 4 piece Semi Ensuite with Custom Medicine Cabinet, Two additional Spacious Bedrooms and Linen Closet! The Finished Lower Level Boasts a Generous Size Bonus Room with Wood Burning Fireplace & Pot Lights to Relax & Unwind, A Large Laundry room with Sink, Custom Built Storage Under the Stairs! Extra Long Driveway for Extra Parking, Entrance to Garage from Home! This is an End Unit Home and a Separate Side Door can be "Easily" put in for a lower level Inlaw Suite! Steps away from Amazing Schools, TTC bus stops, located at equal distance from Kennedy or Finch subway station. Super close to Walmart, Agincourt Mall, Agincourt GO Station, Pacific Mall, Highways 401,404, Scarborough Hospital Birchmount. Finch-Kennedy GO Station (also referred to as Finch East) is a planned GO train station to be built as part of the SmartTrack Stations Program construction to be completed Aug. 2027, 5 Min Walk.
All S/S Appliances, All Window Coverings, All Electric Light Fixtures, Front Siding 2024, Front Door 2019, Garage Door 2023 with Remote, Kitchen Cupboards 2016, Hardwood Main Floor 2016, Freshly Painted T/out 2024, Patio & Side Fence 2020, Back Fence 2024, Windows 2008 & 2022, Roof 2022, Furnace 2009, Microwave 2025, 100 amp service 2016
Living
Dining
Kitchen
Breakfast
Primary
2nd Br
3rd Br
Rec
Laundry
The graph below compares the average list price and average sale price of homes in this neighborhood by month for the last 24 months. When average sale price is greater than average list price, this may suggest a buyer's market. When average sale price is lower than the average list price this may suggest a seller's market.
The graph below illustrates the average days on market for homes in this neighborhood. The yellow area may indicate a buyer's market, the green area may indicate a balanced market and the red area may indicate a seller's market.
Sales Representative, Century 21 People’s Choice Realty Inc., Brokerage
(647) 576 - 2100